
AngloGold Ashanti PLC (AU – Free Report) and Newmont Corporation (NEM – Free Report) are leading global gold mining names with diversified operations across multiple continents. Gold prices hit a record $3,211 per ounce yesterday, fueled by a weaker U.S. dollar, rising safe-haven demand and the intensifying U.S.-China trade tensions. The United States raised tariffs on China imports to 145%, with a new 125% levy added on top of an earlier 20% duty. China retaliated by imposing 125% tariffs on U.S. goods, up from the previously announced 84%.
Gold prices have jumped 22% year to date. This trend is expected to continue, fueled by robust central bank buying, expanding industrial use in energy, healthcare and technology, and escalating trade tensions. Backed by this rally, the Zacks Mining – Gold industry has jumped 34.3% year to date against the Zacks Basic Materials sector’s 1.6% dip.
For investors looking to ride this momentum, the question is: which gold stock should you put your money on? To find out more, let us dive into the fundamentals, growth prospects and challenges of both AngloGold Ashanti and Newmont Corporation.
The Case for AngloGold Ashanti
As of Dec. 31, 2024, the company had a diverse portfolio, including 11 operating assets in Argentina, Australia, Brazil, the Democratic Republic of the Congo, Egypt, Ghana, Guinea and Tanzania.
In November 2024, the company acquired Egyptian gold producer Centamin, adding the large-scale, long-life, world-class Tier 1 asset (Sukari) to its portfolio. It has the potential to produce 500,000 ounces annually. With this addition, the proportion of gold production from its Tier 1 assets has moved up from 62% to 67%.
AU’s total gold production in 2024, including a contribution of 40,000 ounces from Sukari, was 2.661 million ounces. Gold production for 2025 is projected at 2.9-3.225 million ounces. Following the acquisition of Centamin, AngloGold Ashanti’s mineral reserves were 31.2 million ounces at the end of 2024.
Despite the Centamin acquisition, AngloGold Ashanti ended 2024 with an adjusted net debt to adjusted EBITDA of 0.21, which is the lowest since 2011. The company had $2.6 billion in liquidity, including cash and cash equivalents of $1.4 billion as of Dec. 31, 2024.
AU’s board of directors recently approved a revised dividend policy, per which it will target a 50% payout of free cash flow, subject to maintaining an adjusted net debt to adjusted EBITDA of 1.0x. The revised policy introduces a base dividend of 50 cents per share per year. AU’s current payout ratio of 18.55% is lower than the industry’s 29.68%.
The company has been facing cost pressures on labor, material and contractor costs, and the impacts of higher royalties paid. Total cash costs per ounce for the company rose 4% year over year to $1,157 per ounce in 2024. Total cash costs have seen a CAGR of 4.8% over 2022-2024. All-in-sustaining costs per ounce (“AISC”) for AU rose 4% year over year to $1,611 per ounce in 2024. The company’s AISC has grown, witnessing a CAGR of 6.2% over 2022-2024. AngloGold Ashanti, meanwhile, remains focused on its Full Asset Potential program to offset the inflationary impacts.
The proposed joint venture (that was announced in May 2023) between Gold Fields (GFI – Free Report) and AngloGold Ashanti to combine their Tarkwa and Iduapriem gold mines in Ghana has hit a roadblock. Gold Fields and AngloGold Ashanti have not yet secured the requisite approvals by the Ghana government. The combination of these neighboring mines is expected to create the largest gold mine in Africa, with an extended life, higher production and lower costs. Meanwhile, AngloGold Ashanti and Gold Fields remain focused on improving their respective assets.
The Case for Newmont
Beside gold, Newmont produces copper, zinc, lead and silver. The company’s world-class portfolio of assets is placed in favorable mining jurisdictions in Africa, Australia, Latin America and the Caribbean, North America, and Papua New Guinea.
NEM has completed the integration of Newcrest assets (which was acquired in November 2023), solidifying its position as the world’s largest gold producer with growth opportunities in copper. The company is also divesting non-core businesses as it shifts its strategic focus to Tier 1 assets.
The company produced 6.8 million attributable gold ounces in 2024, primarily driven by the production of 5.7 million attributable gold ounces from Newmont’s Tier 1 Portfolio. Attributable production for 2025 is forecast to be 5.9 million gold ounces, with 0.3 million ounces from non-core assets held for sale and 5.6 million ounces from the total Tier 1 portfolio. Newmont reported gold mineral reserves of 134.1 million attributable ounces at the end of 2024.
Also, at 2024 end, NEM’s net debt to adjusted EBITDA stood at 0.6X. The company had $7.7 billion in total liquidity, including $3.6 billion in cash.
The company paid out $1.1 billion in total dividends to shareholders in 2024. NEM’s payout ratio of 28.74% is close to the industry average of 29.68%. Newmont repurchased shares worth $1.2 billion under its $3-billion total share repurchase program in 2024.
NEM continues to grapple with higher costs for materials, particularly labor. Gold costs applicable to sales (CAS) moved up 7% to $1,126 per ounce in 2024. Gold AISC rose 5% to $1,516 per ounce. Over 2022-2024, CAS saw a CAGR of 7%, while AISC witnessed a CAGR of 5%.
How Do Estimates Compare for AU & NEM?
The Zacks Consensus Estimate for AngloGold Ashanti’s 2025 earnings is at $2.49, indicating year-over-year growth of 16.7%. The estimate for 2026 suggests a rise of 7.4%. EPS estimates for both 2025 and 2026 have been trending south over the past 60 days.
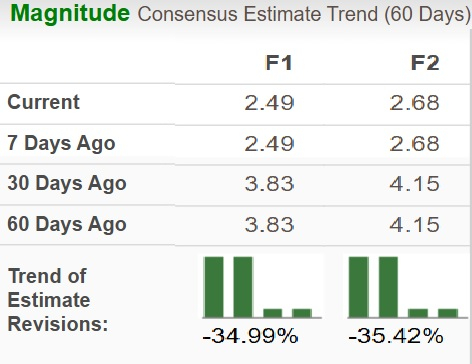
Image Source: Zacks Investment Research
The Zacks Consensus Estimate for Newmont’s earnings for 2025 is at $3.69, indicating a year-over-year jump of 6%. The 2026 estimate implies growth of 9.4%. The estimates have been trending north over the past 60 days.
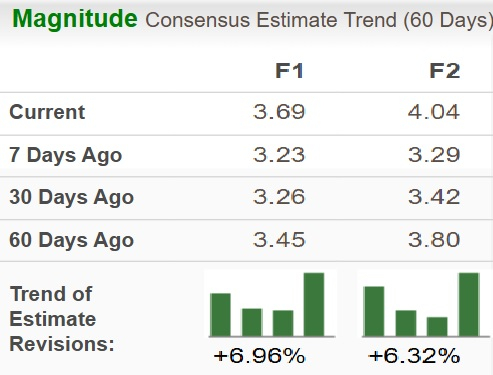
Image Source: Zacks Investment Research
Find the latest earnings estimates and surprises on Zacks Earnings Calendar.
AU & NEM: Price Performance, Valuation & Other Comparisons
Year to date, the AU stock has surged 68.3%, whereas NEM has gained 36.9%, both outperforming the industry’s rally of 34.3%.
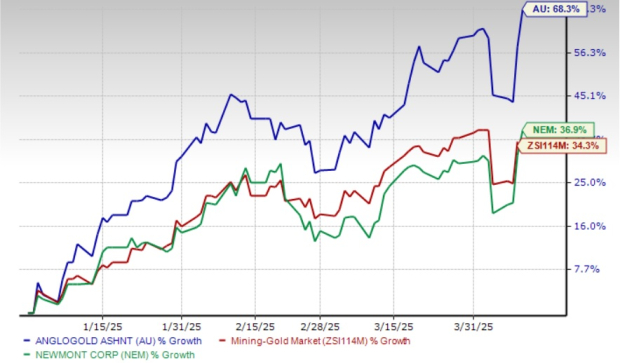
Image Source: Zacks Investment Research
AU is currently trading at a forward 12-month earnings multiple of 15.29X, higher than its five-year median. The NEM stock is currently trading at a forward 12-month earnings multiple of 15.70X, lower than its five-year median. Both are currently trading at a premium to the industry average of 15.00X.
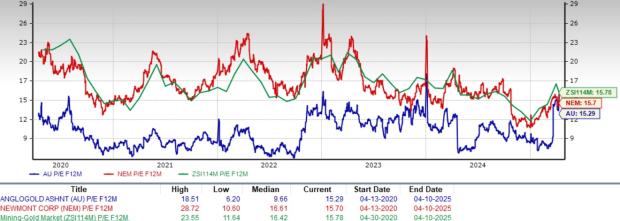
Image Source: Zacks Investment Research
The average price target on AngloGold Ashanti suggests a 6.05% decline from its last closing price of $38.84. The highest target of $41 implies a gain of 5.5%.
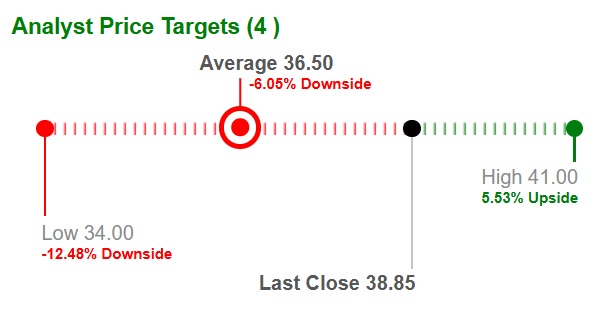
Image Source: Zacks Investment Research
Meanwhile, the average price target on Newmont suggests an 11.70% increase from its last closing price of $50.94. The highest target of $72.32 indicates a rise of 42%.
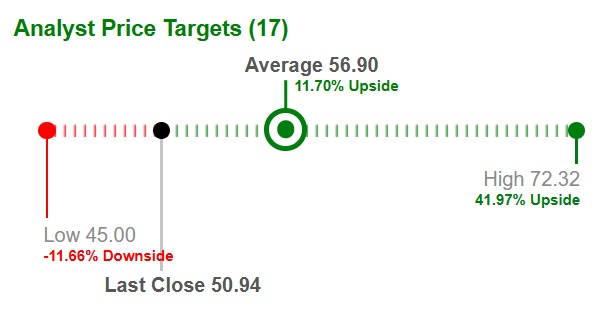
Image Source: Zacks Investment Research
AU’s return on equity of 11.47% is lower than NEM’s 13.46%. This reflects AngloGold Ashanti’s relatively less efficient use of shareholder equity in generating profits.
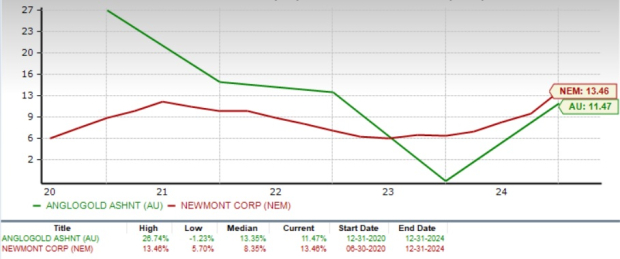
Image Source: Zacks Investment Research
Conclusion
Both AngloGold Ashanti and Newmont are poised to benefit from the current surge in gold prices and higher production expectations despite increased costs. NEM provides added appeal through its diversification into copper, offering a broader commodity exposure.
While AU has outperformed NEM in terms of year-to-date price gains, the recent downward trend in earnings estimates raise caution. AngloGold Ashanti’s stalled ambitions to build Africa’s largest gold mine continue to weigh on investor sentiment.
Meanwhile, Newmont stands out with a more stable dividend policy, an active share repurchase program, a higher return on equity and greater upside based on analyst price targets.
Given these factors, Newmont, which currently has a Zacks Rank #3 (Hold) and a Value Score of B, appears to be a more compelling investment choice than AngloGold Ashanti, which carries a Zacks Rank #5 (Strong Sell) and a Value Score of D.
You can see the complete list of today’s Zacks #1 Rank (Strong Buy) stocks here.
Financial Market Newsflash
No financial news published today. Check back later.


