
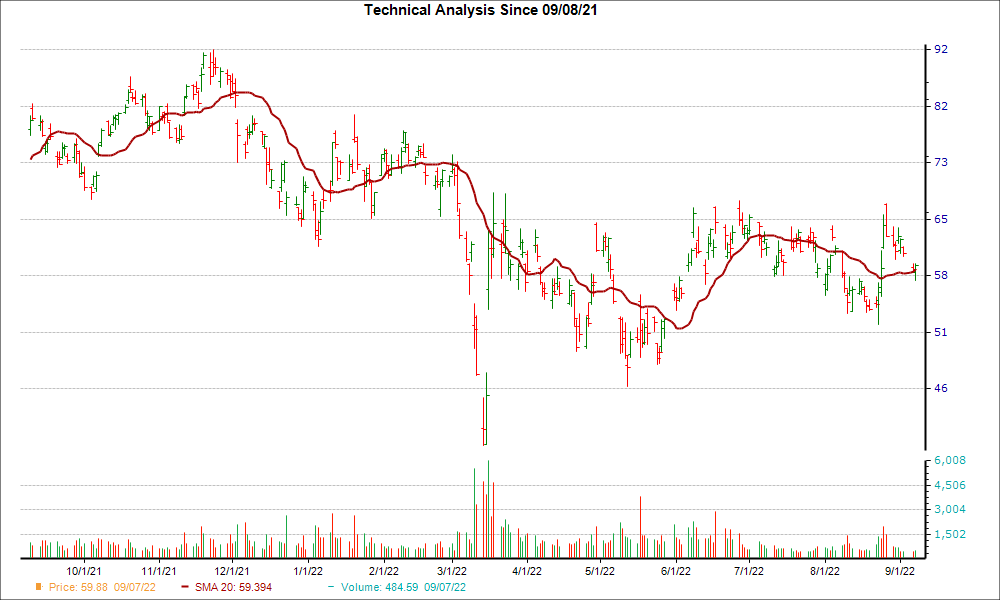
JD.com, Inc. (JD – Free Report) reached a significant support level, and could be a good pick for investors from a technical perspective. Recently, JD broke through the 20-day moving average, which suggests a short-term bullish trend.
The 20-day simple moving average is a well-liked trading tool because it provides a look back at a stock’s price over a 20-day period. Additionally, short-term traders find this SMA very beneficial, as it smooths out short-term price trends and shows more trend reversal signals than longer-term moving averages.
Like other SMAs, if a stock’s price is moving above the 20-day, the trend is considered positive. When the price falls below the moving average, it can signal a downward trend.
JD has rallied 8.3% over the past four weeks, and the company is a Zacks Rank #1 (Strong Buy) at the moment. This combination suggests JD could be on the verge of another move higher.
The bullish case only gets stronger once investors take into account JD’s positive earnings estimate revisions. There have been 2 revisions higher for the current fiscal year compared to none lower, and the consensus estimate has moved up as well.
Investors should think about putting JD on their watchlist given the ultra-important technical indicator and positive move in earnings estimate revisions.
Financial Market Newsflash
No financial news published today. Check back later.


