
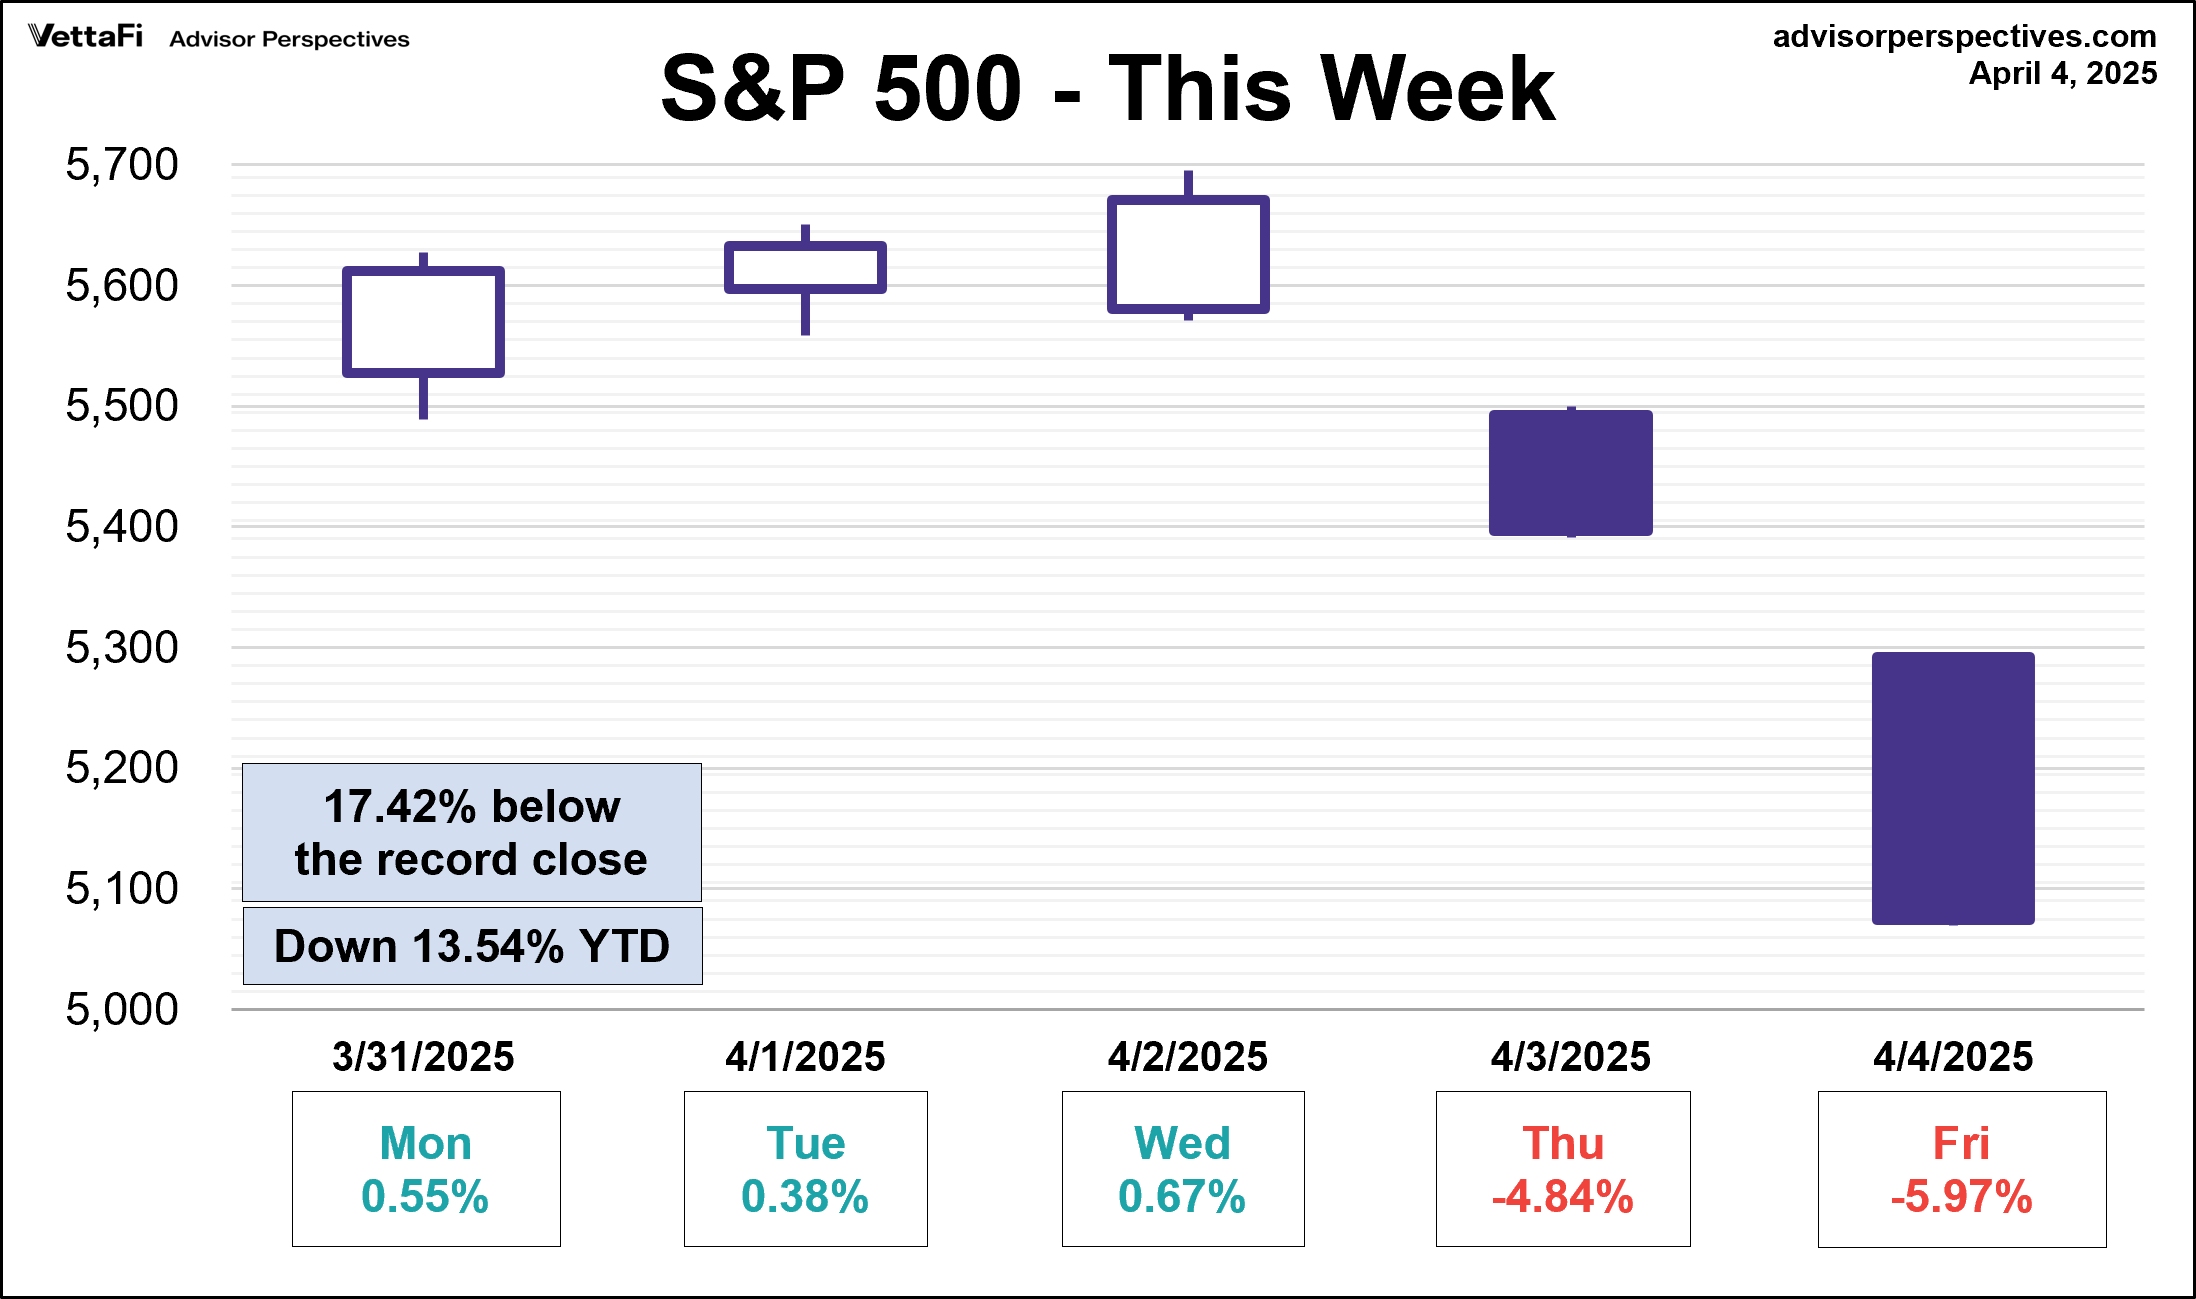
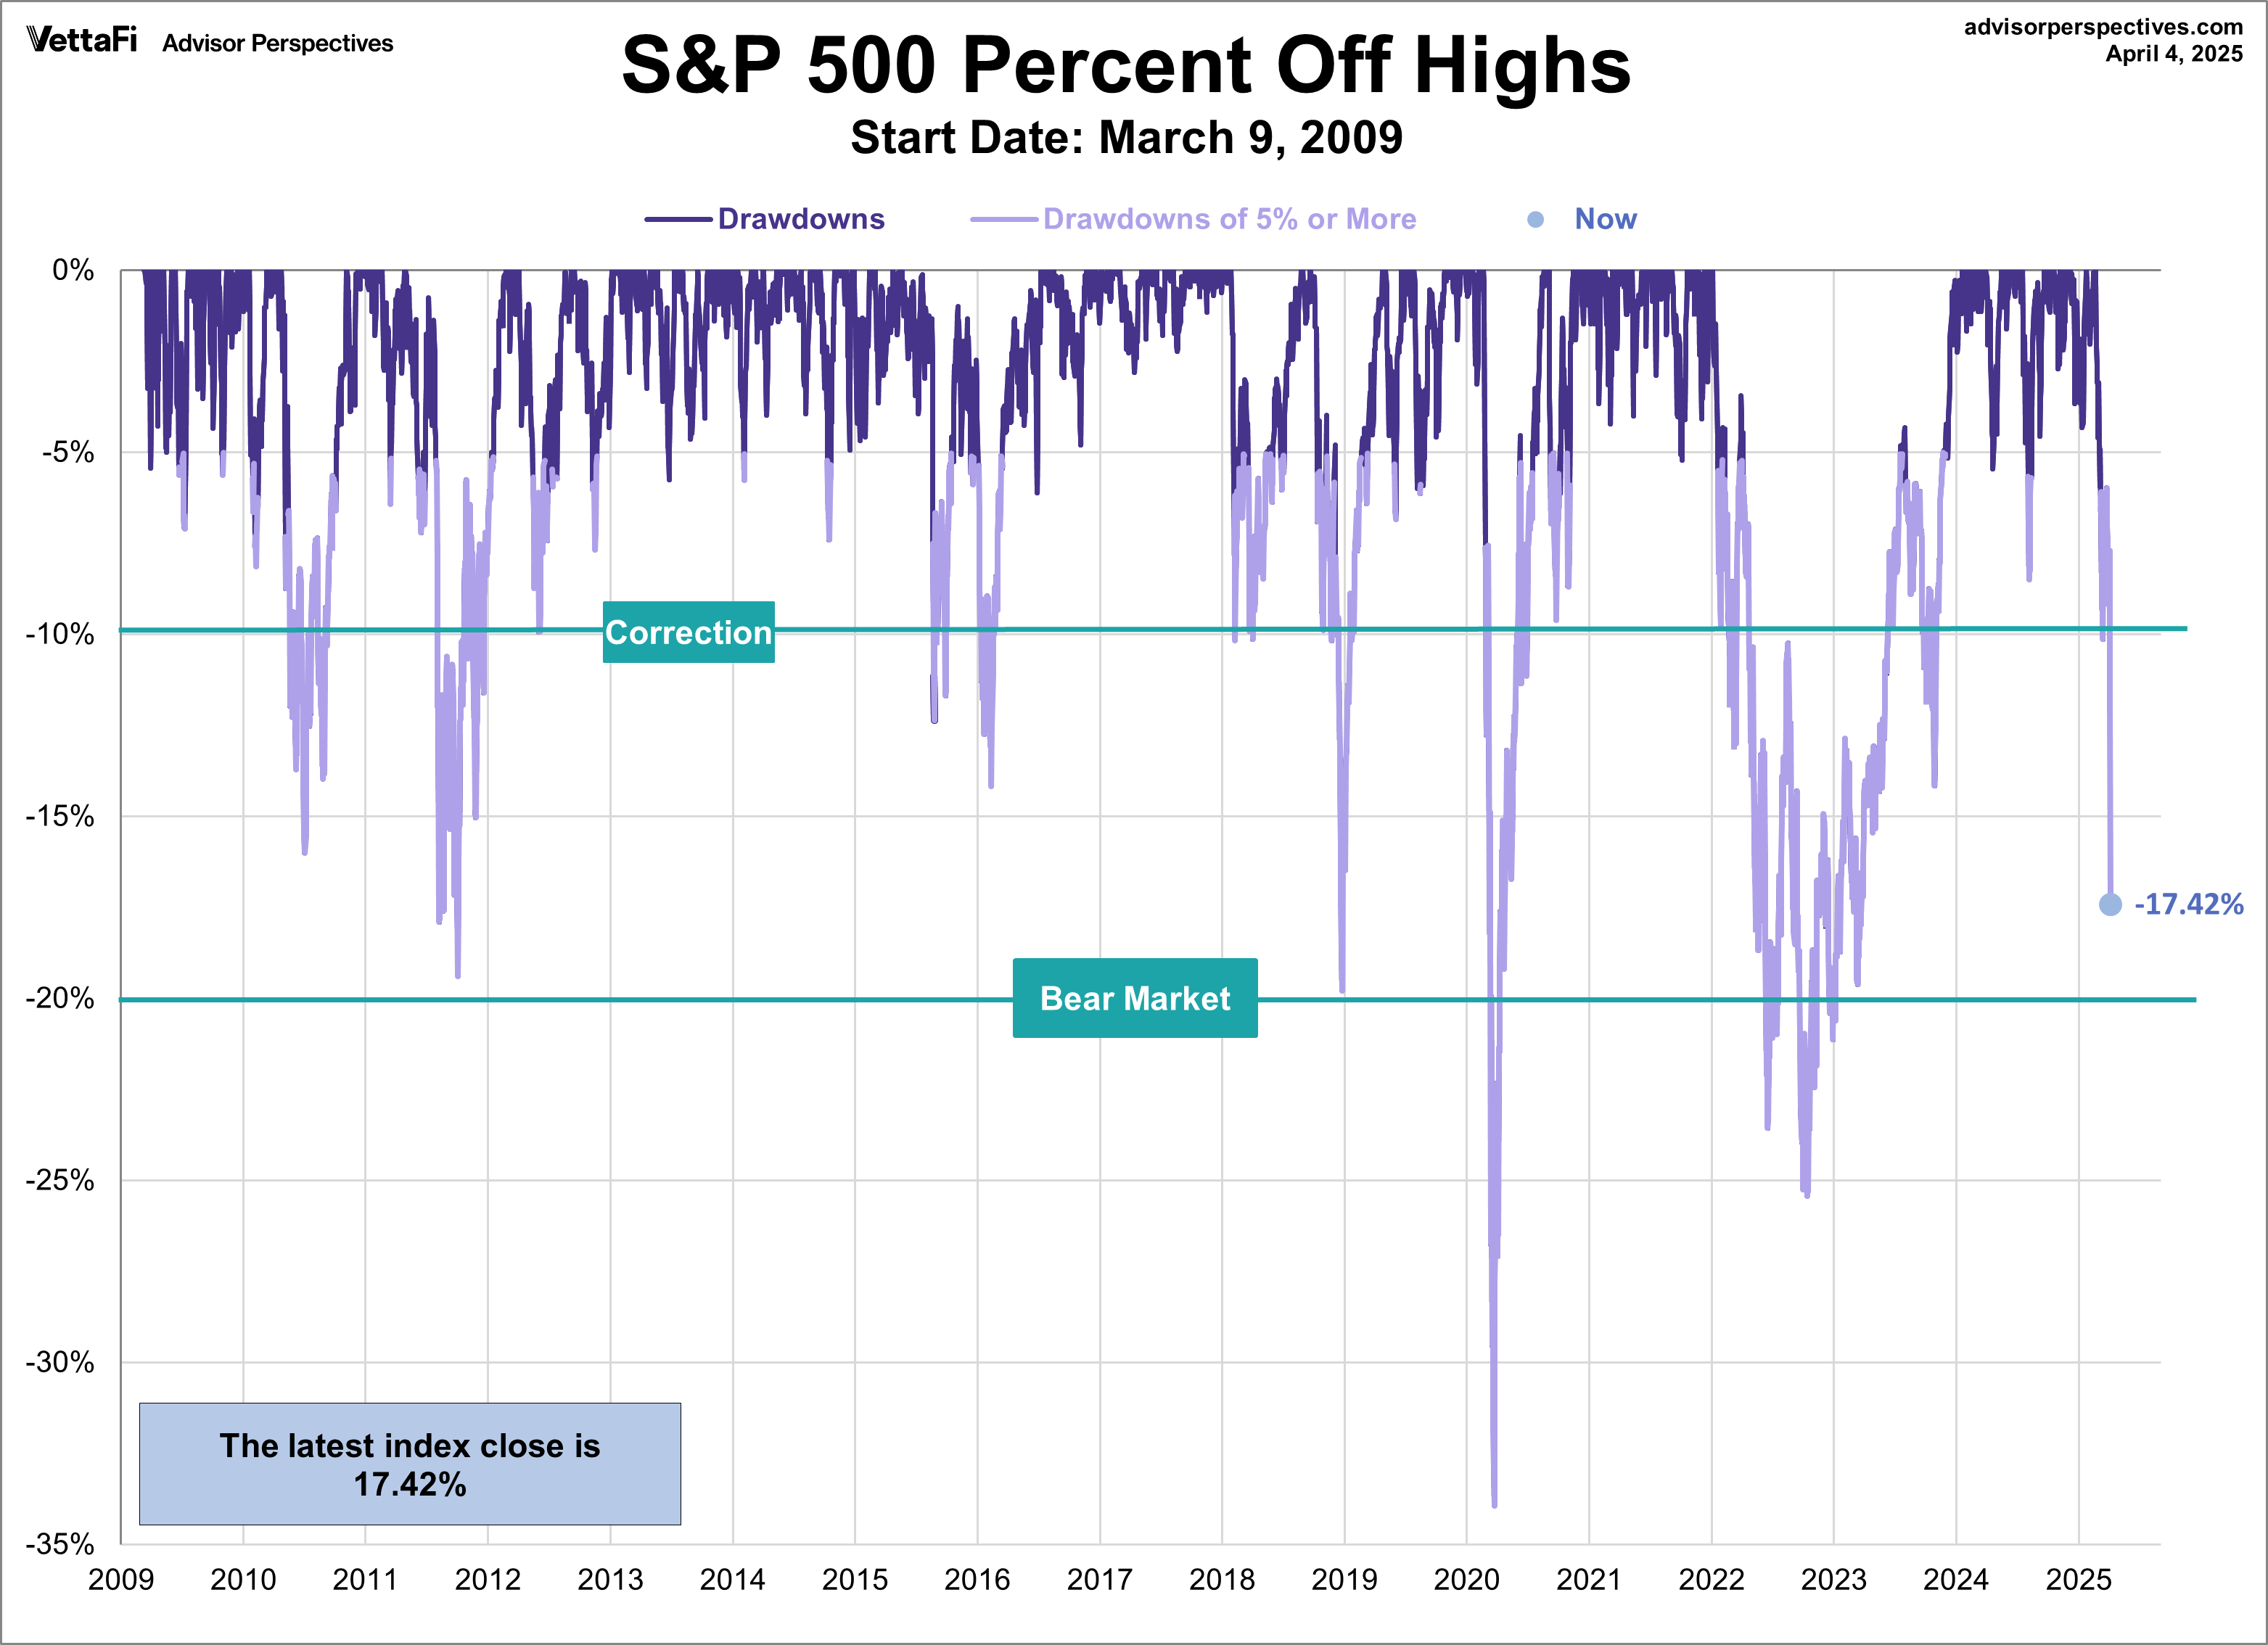
The S&P 500 began the week with three straight daily gains but then “Liberation Day” led the index to its two worst days since March 2020. The index fell 9.1% this week and has re-entered correction territory, sitting 17.42% below its record close from February 19th, 2025.
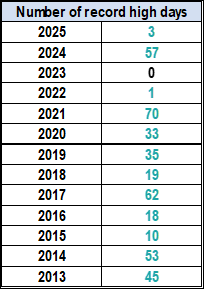
The table below summarizes the number of record highs reached each year dating back to 2013.
Here is a snapshot of the index from the past week:
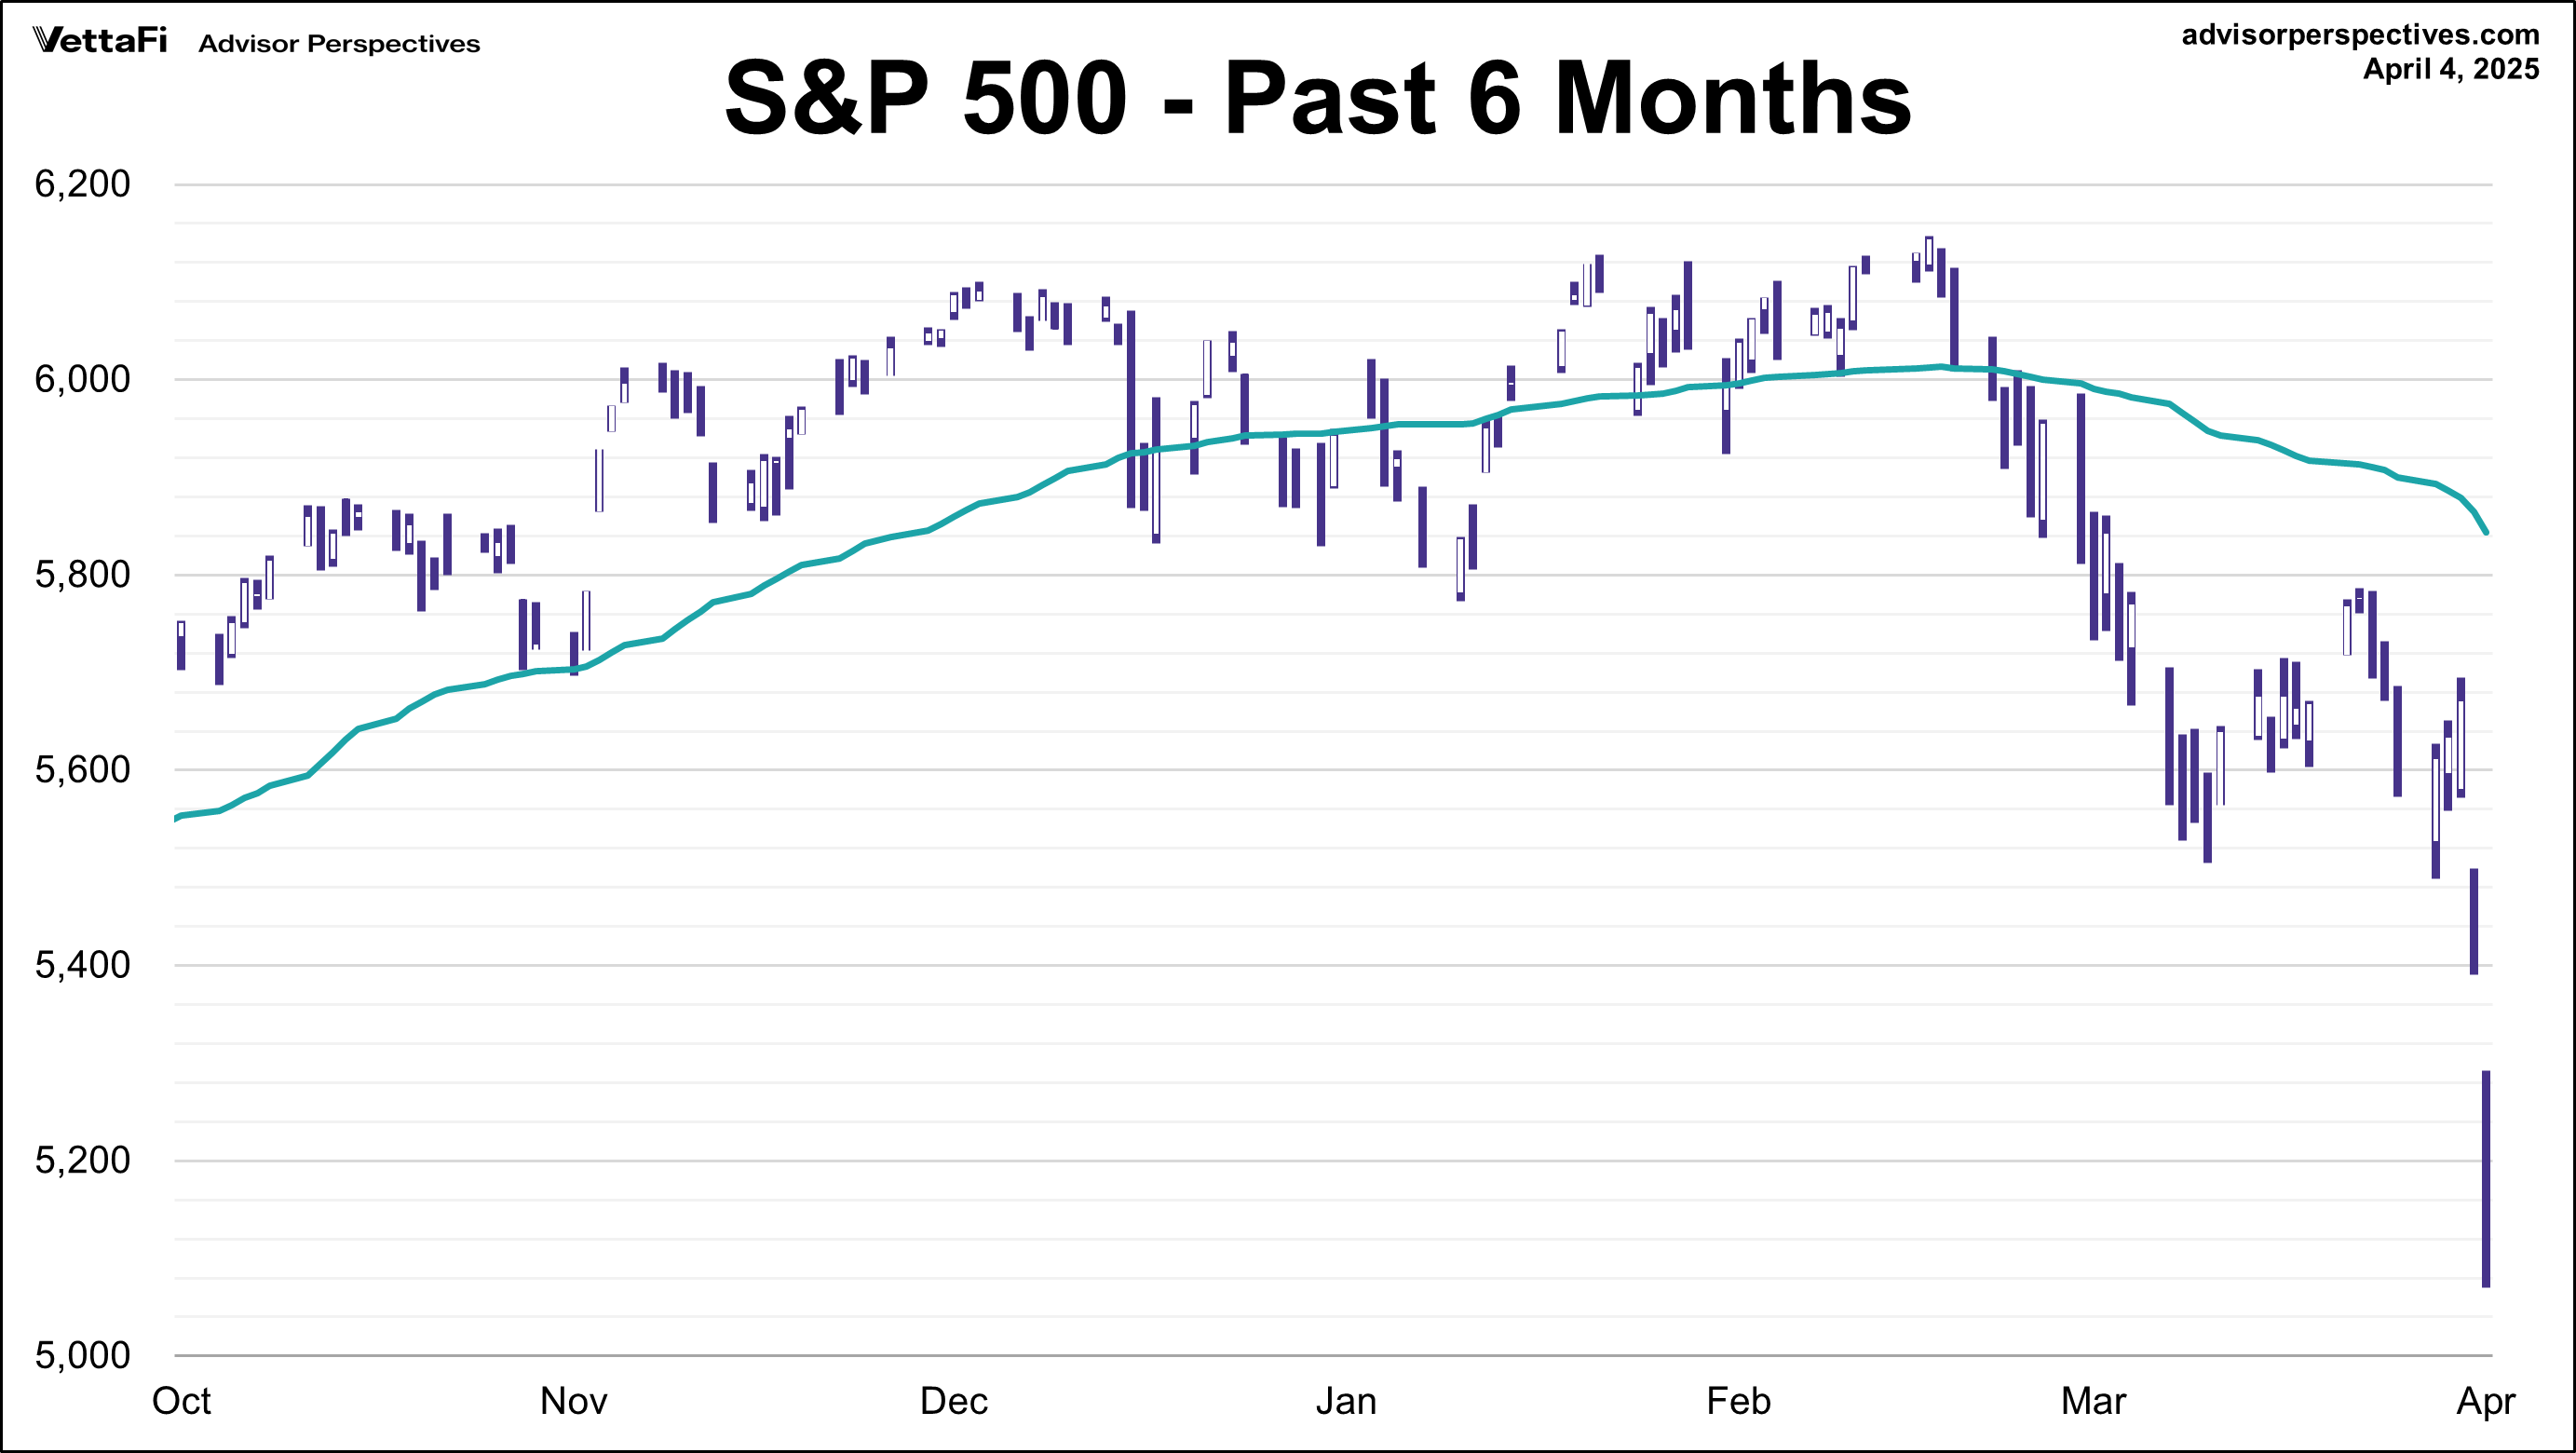
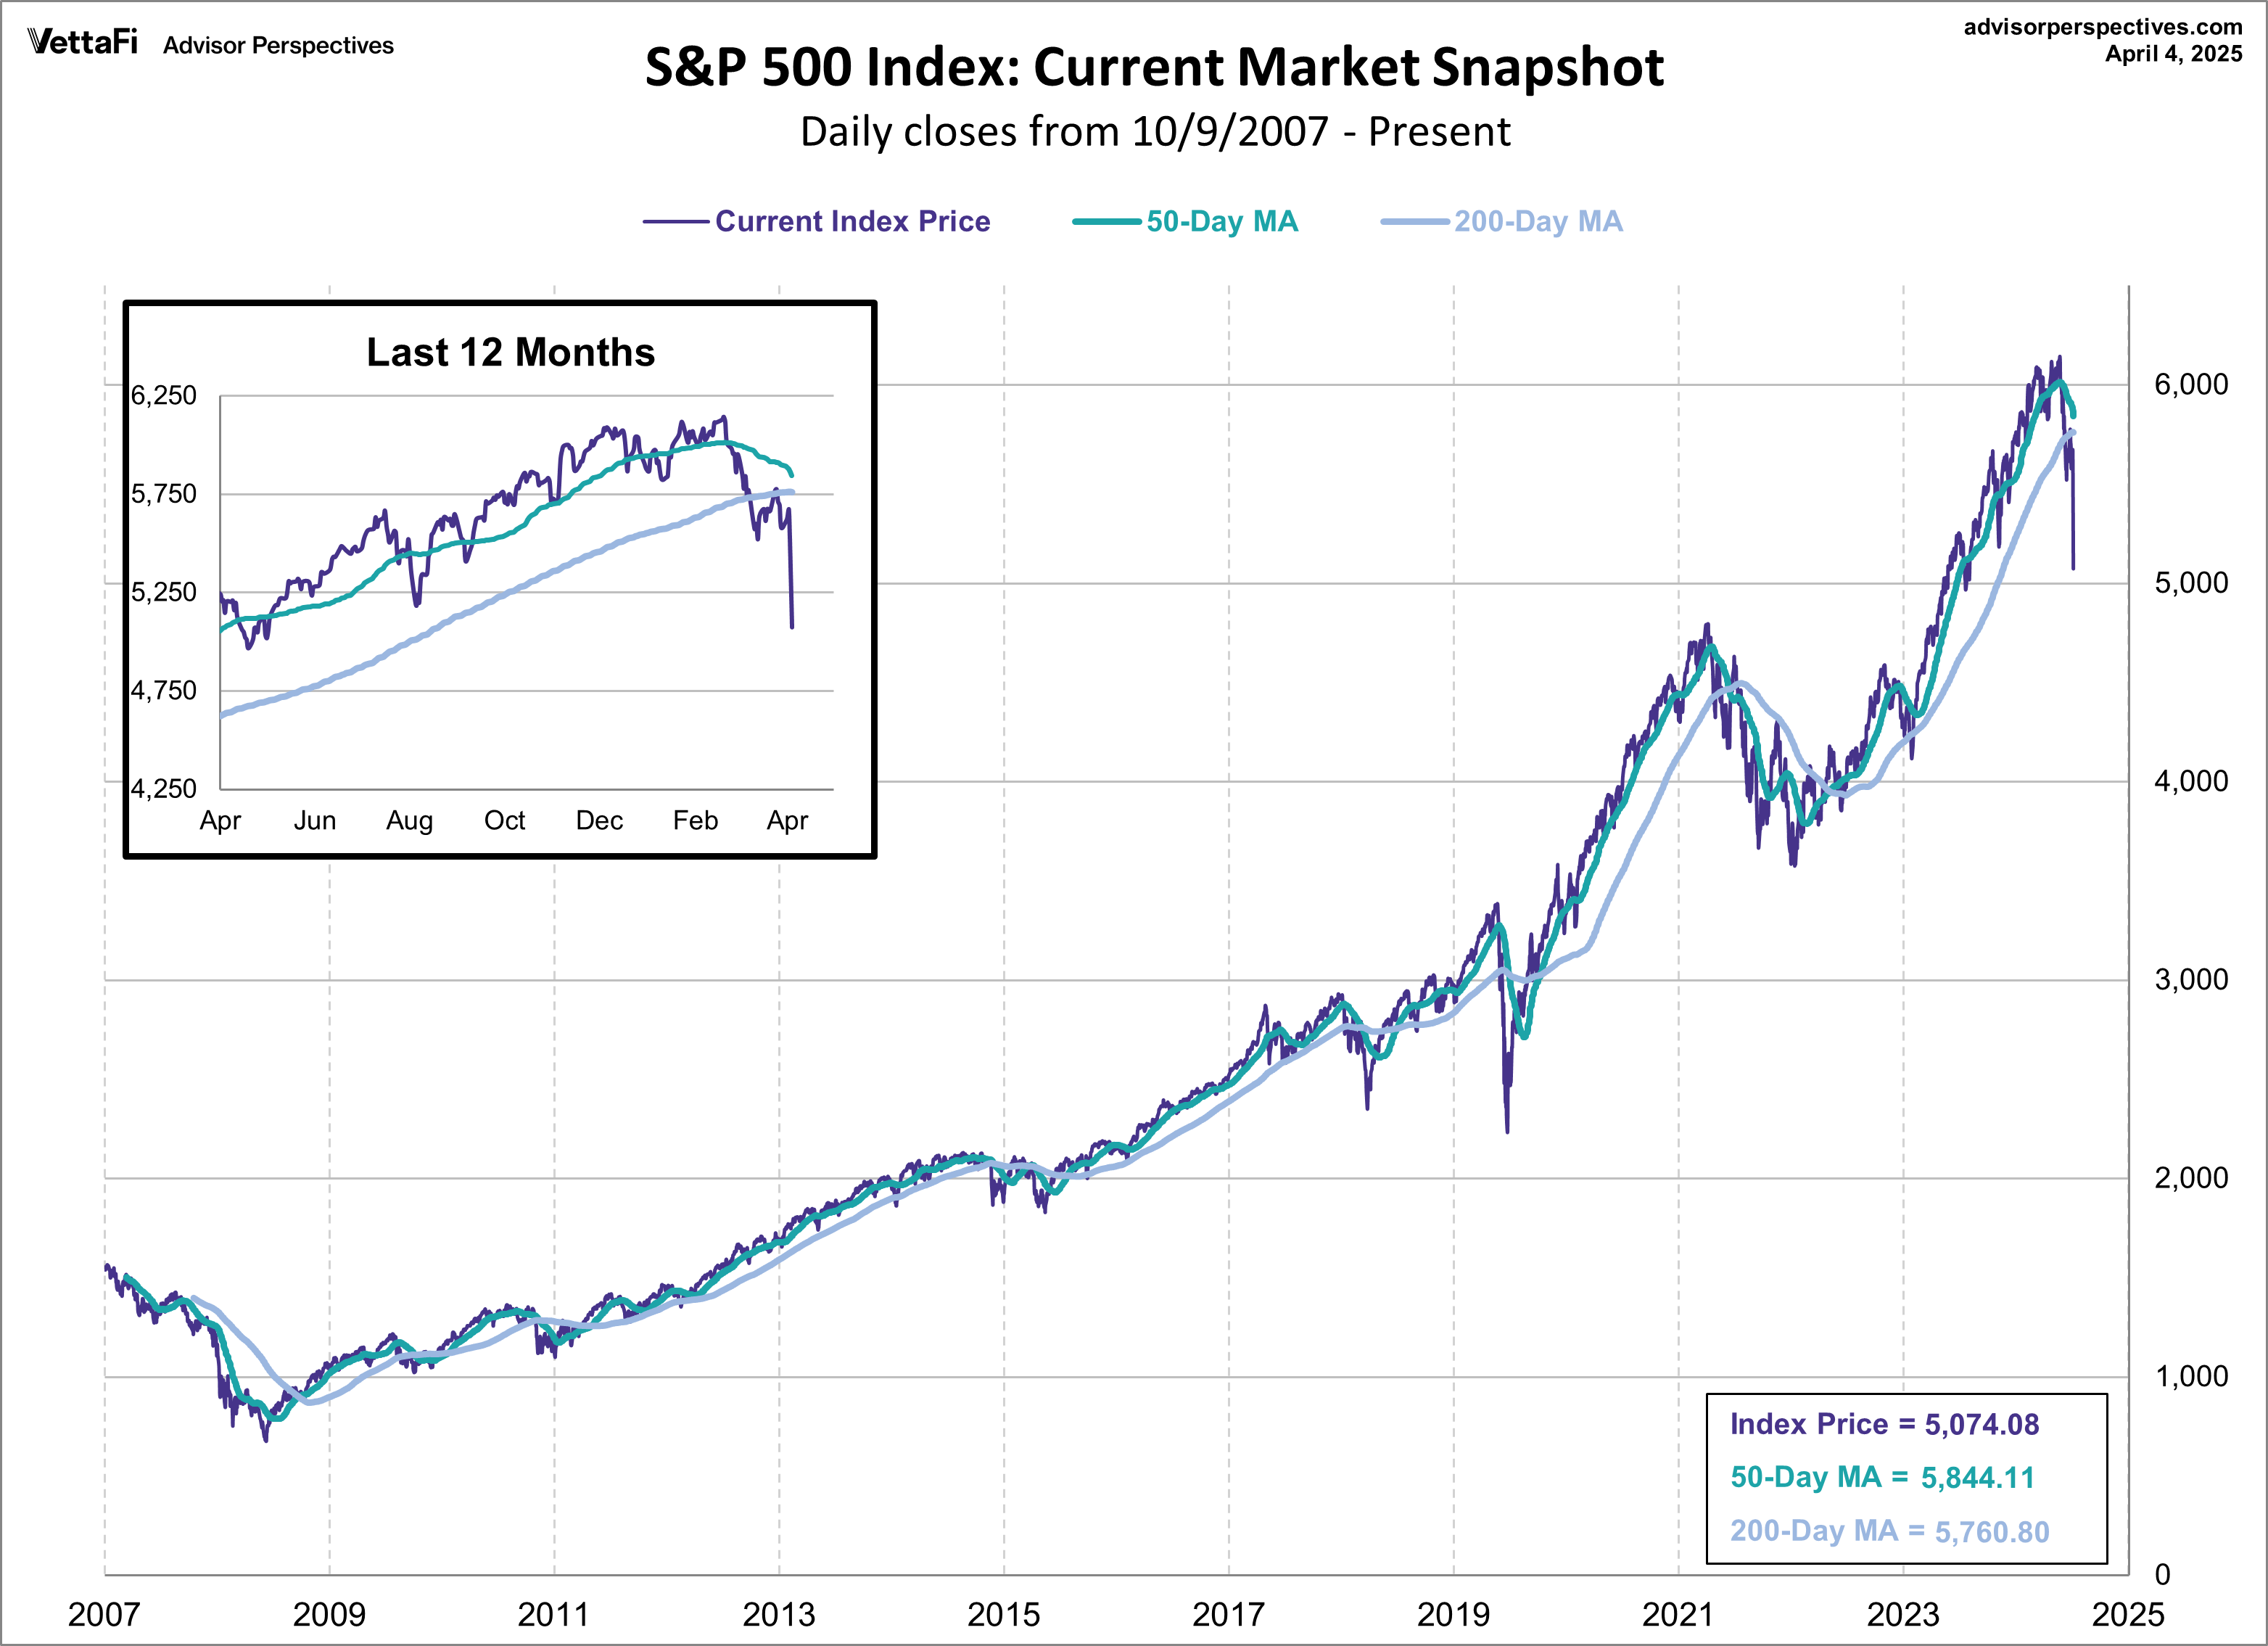
Here is a snapshot of the index from the past six months with a 50-day moving average:
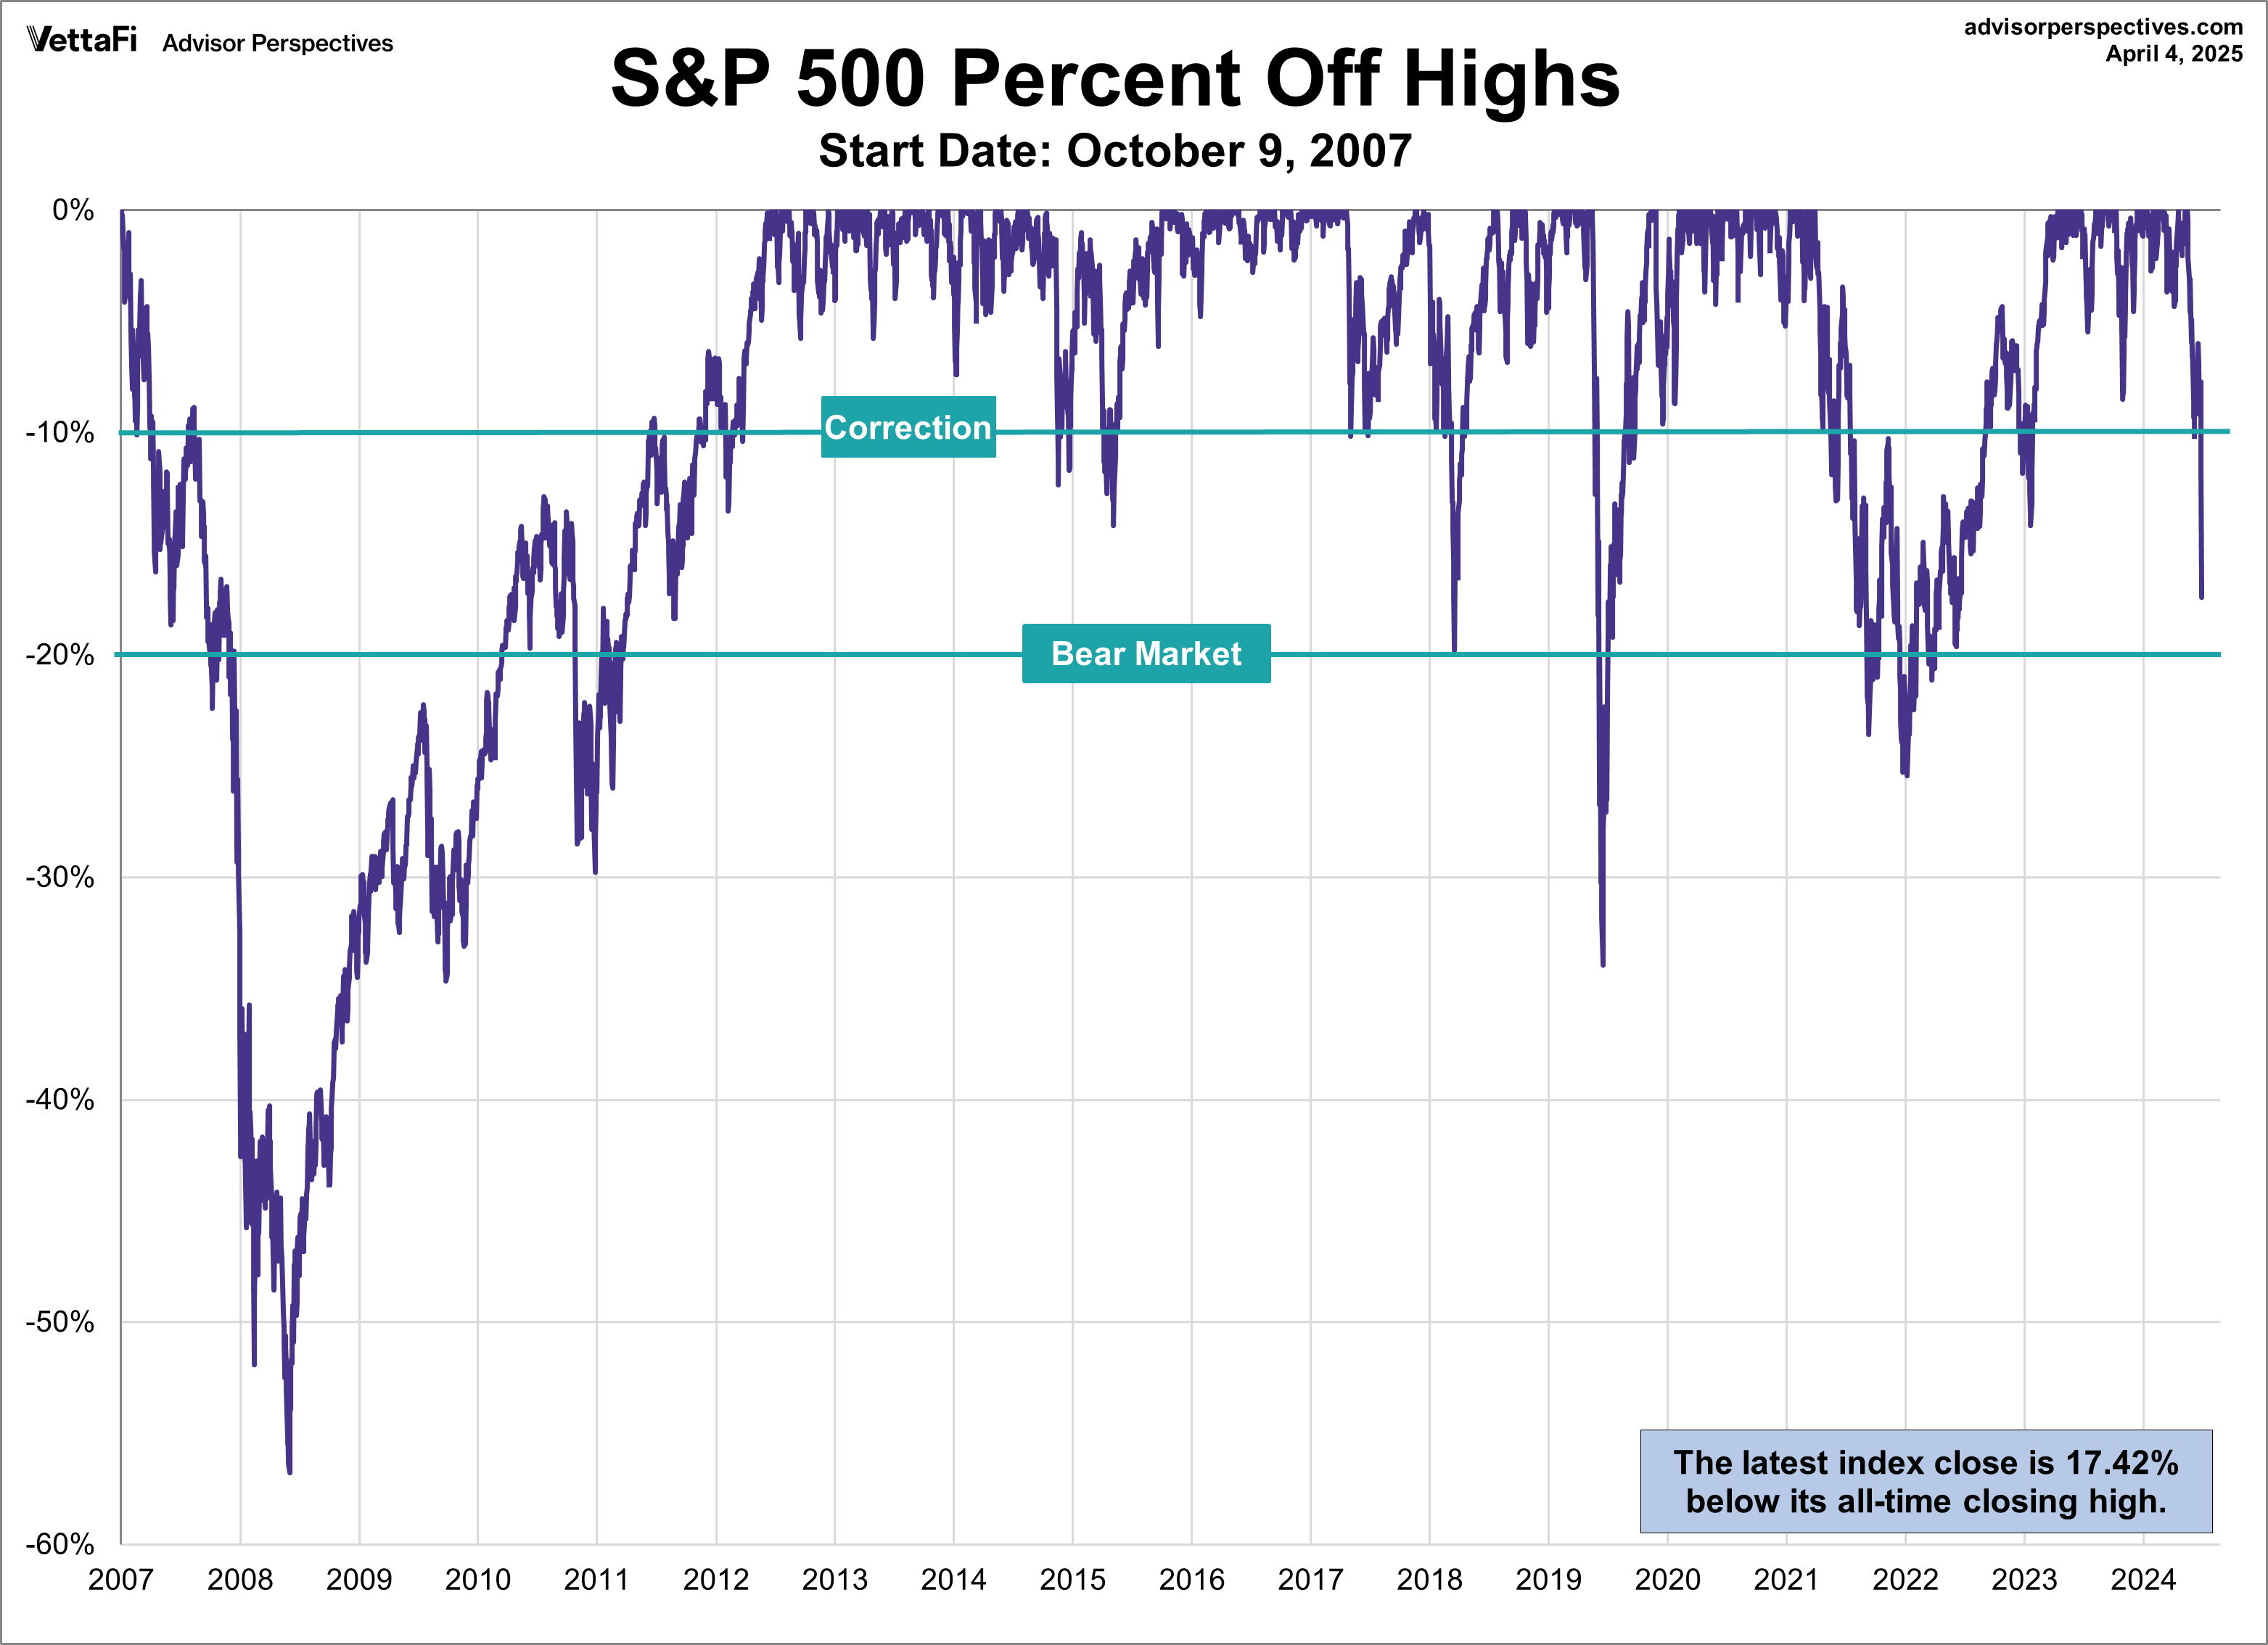
S&P 500: A Perspective on Drawdowns
On October 9, 2007 the S&P 500 reached a then all-time high, closing the day at 1565.15. Then on March 9, 2009, the index dropped ~57% off of its high from exactly 17 months before, closing the day at 676.53. This time period became known as the Global Financial Crisis. It took over 5 years before the index reached a new then all-time high on March 28, 2013, where it closed out at 1569.19. The chart below is a snapshot of record highs and selloffs since the 2007 peak reached on October 9, 2007.
What happens if we take out the Global Financial Crisis? Here’s a snapshot the same chart above where the start date has been changed to the trough reached on March 9, 2009. Note the recent selloffs in 2022.
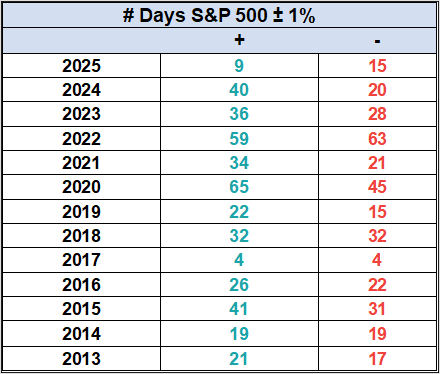
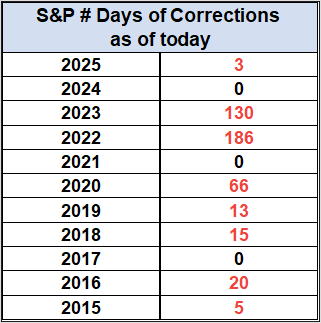
Here’s a few tables with the number of days of a 1% or greater change in either direction and the number of days of corrections (down 10% or more from the record high).
 |
 |
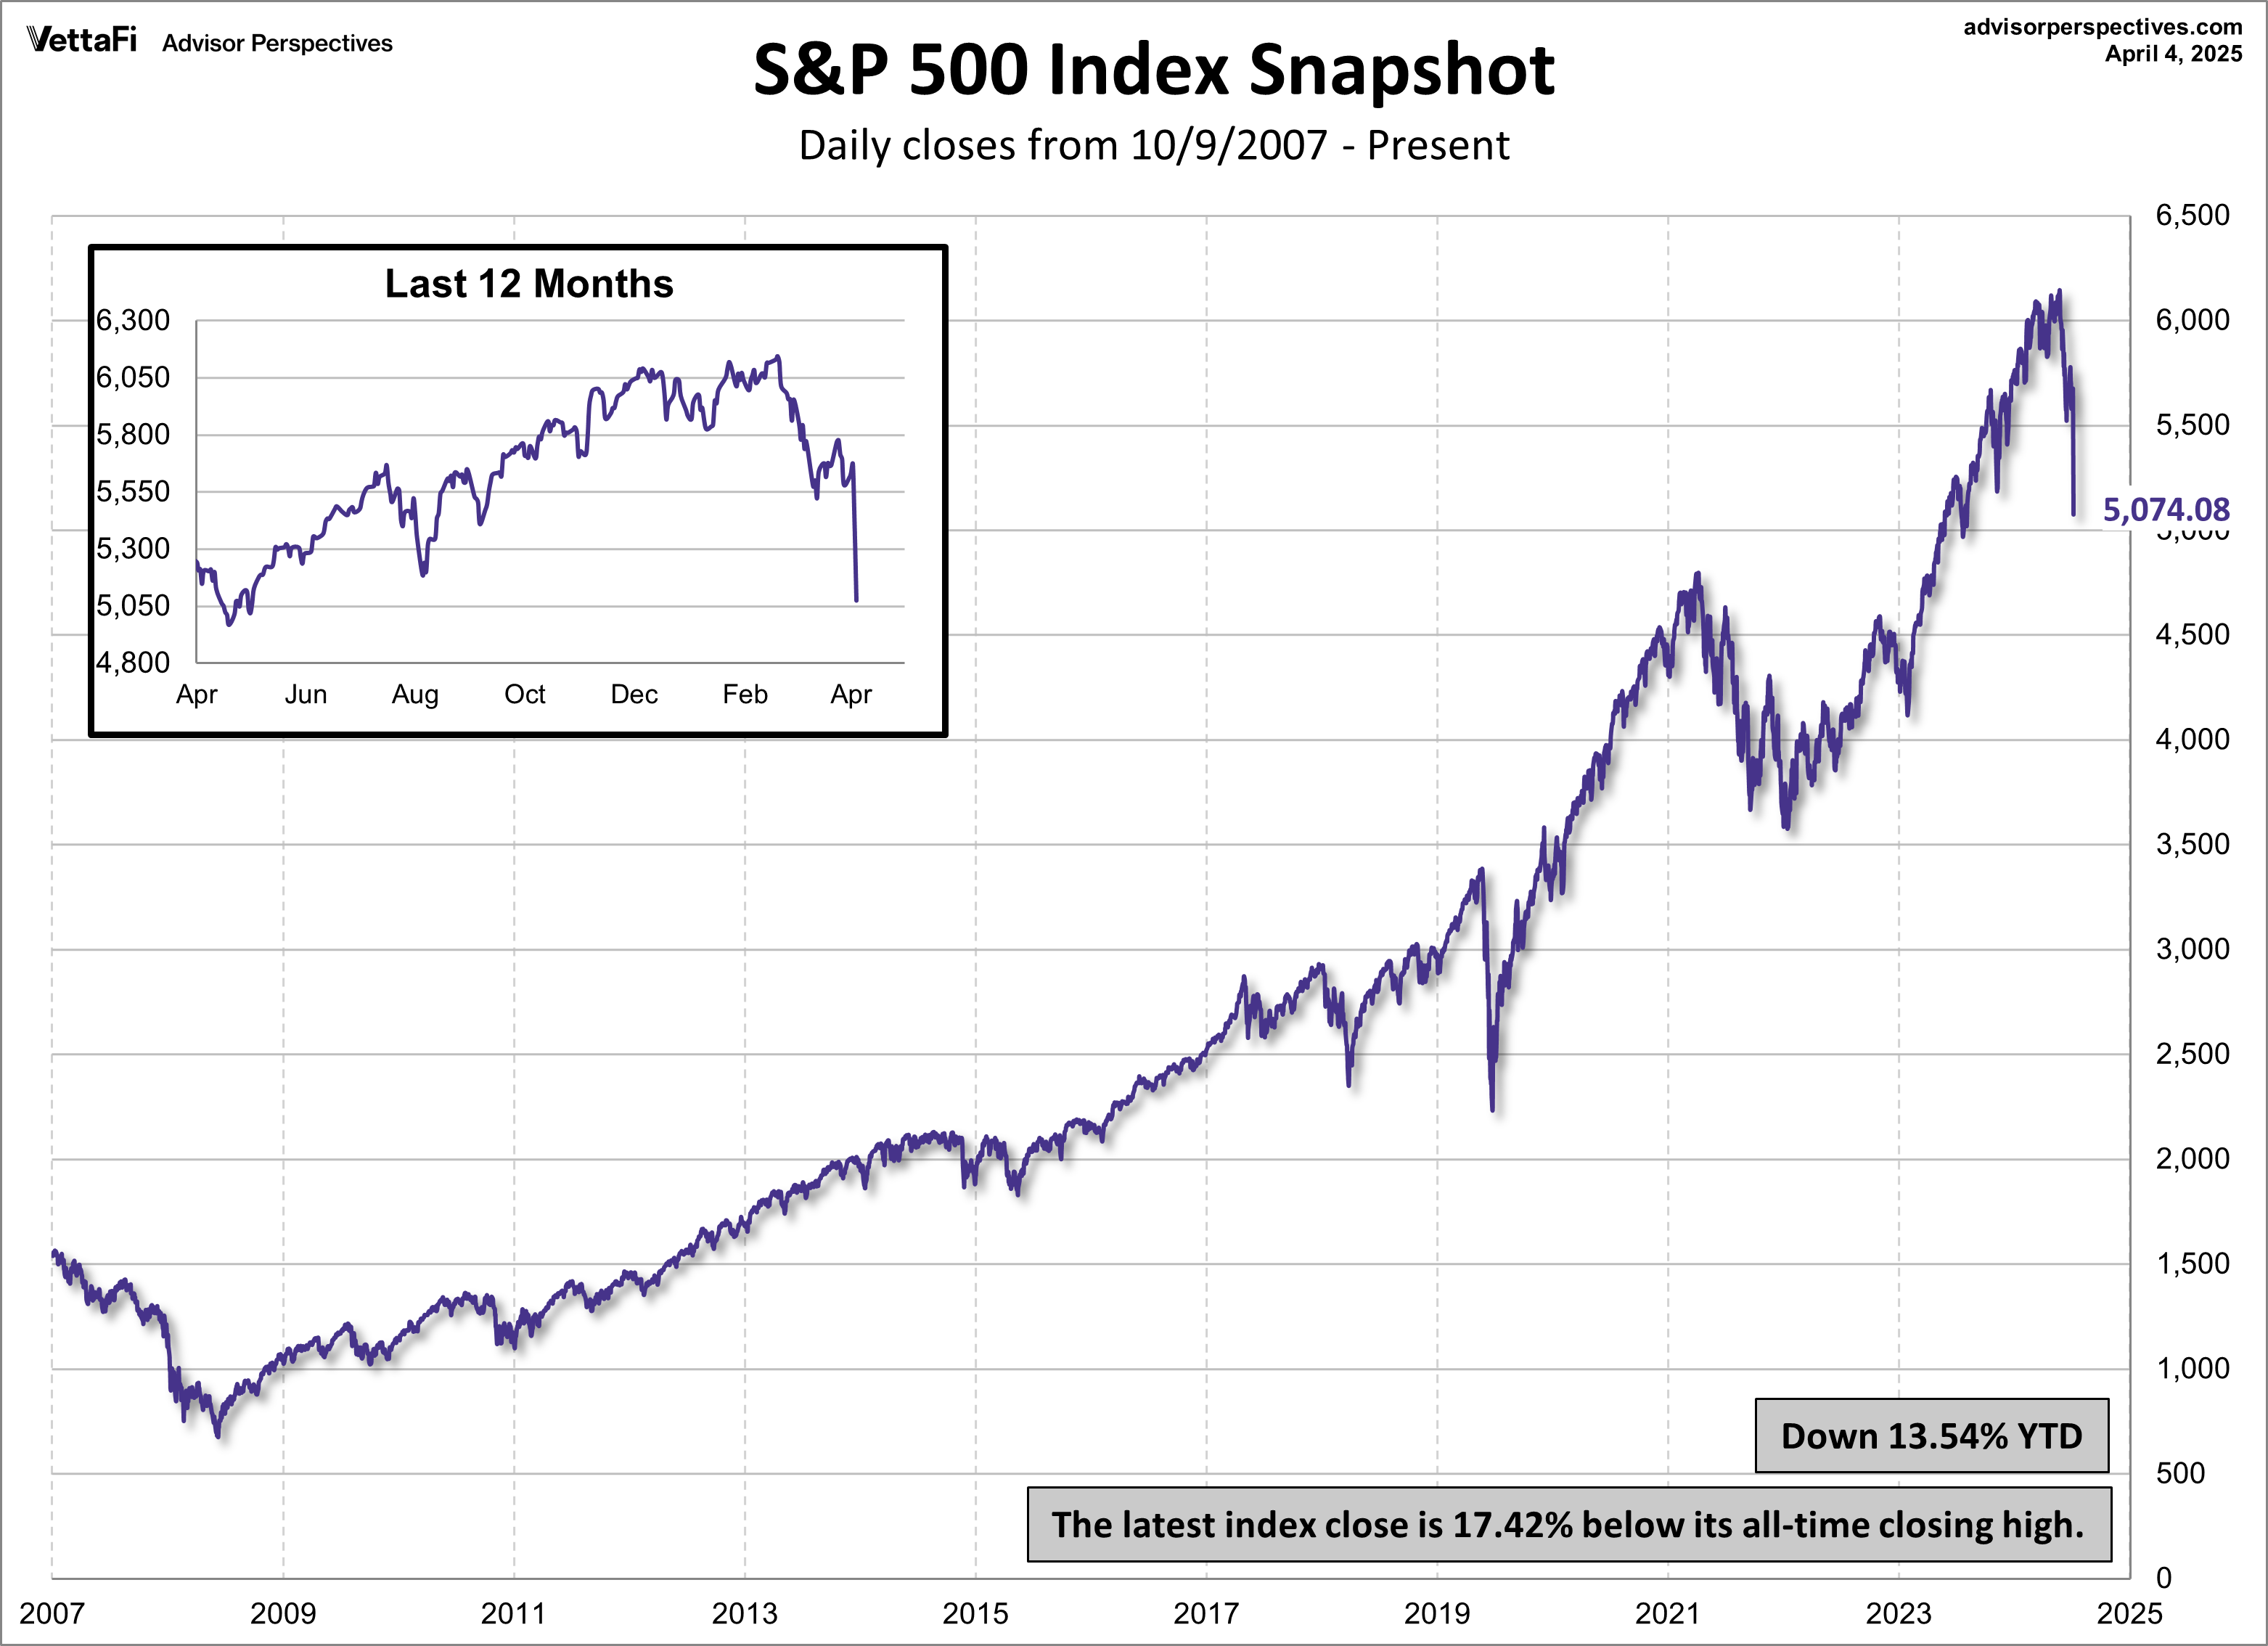
Here is a linear chart of the index since October 9, 2007:
Here is a linearly scaled version of the same chart with the 50- and 200-day moving averages. The index has been below the 50-day moving average since February 24th and below the 200-day moving average since March 26th.
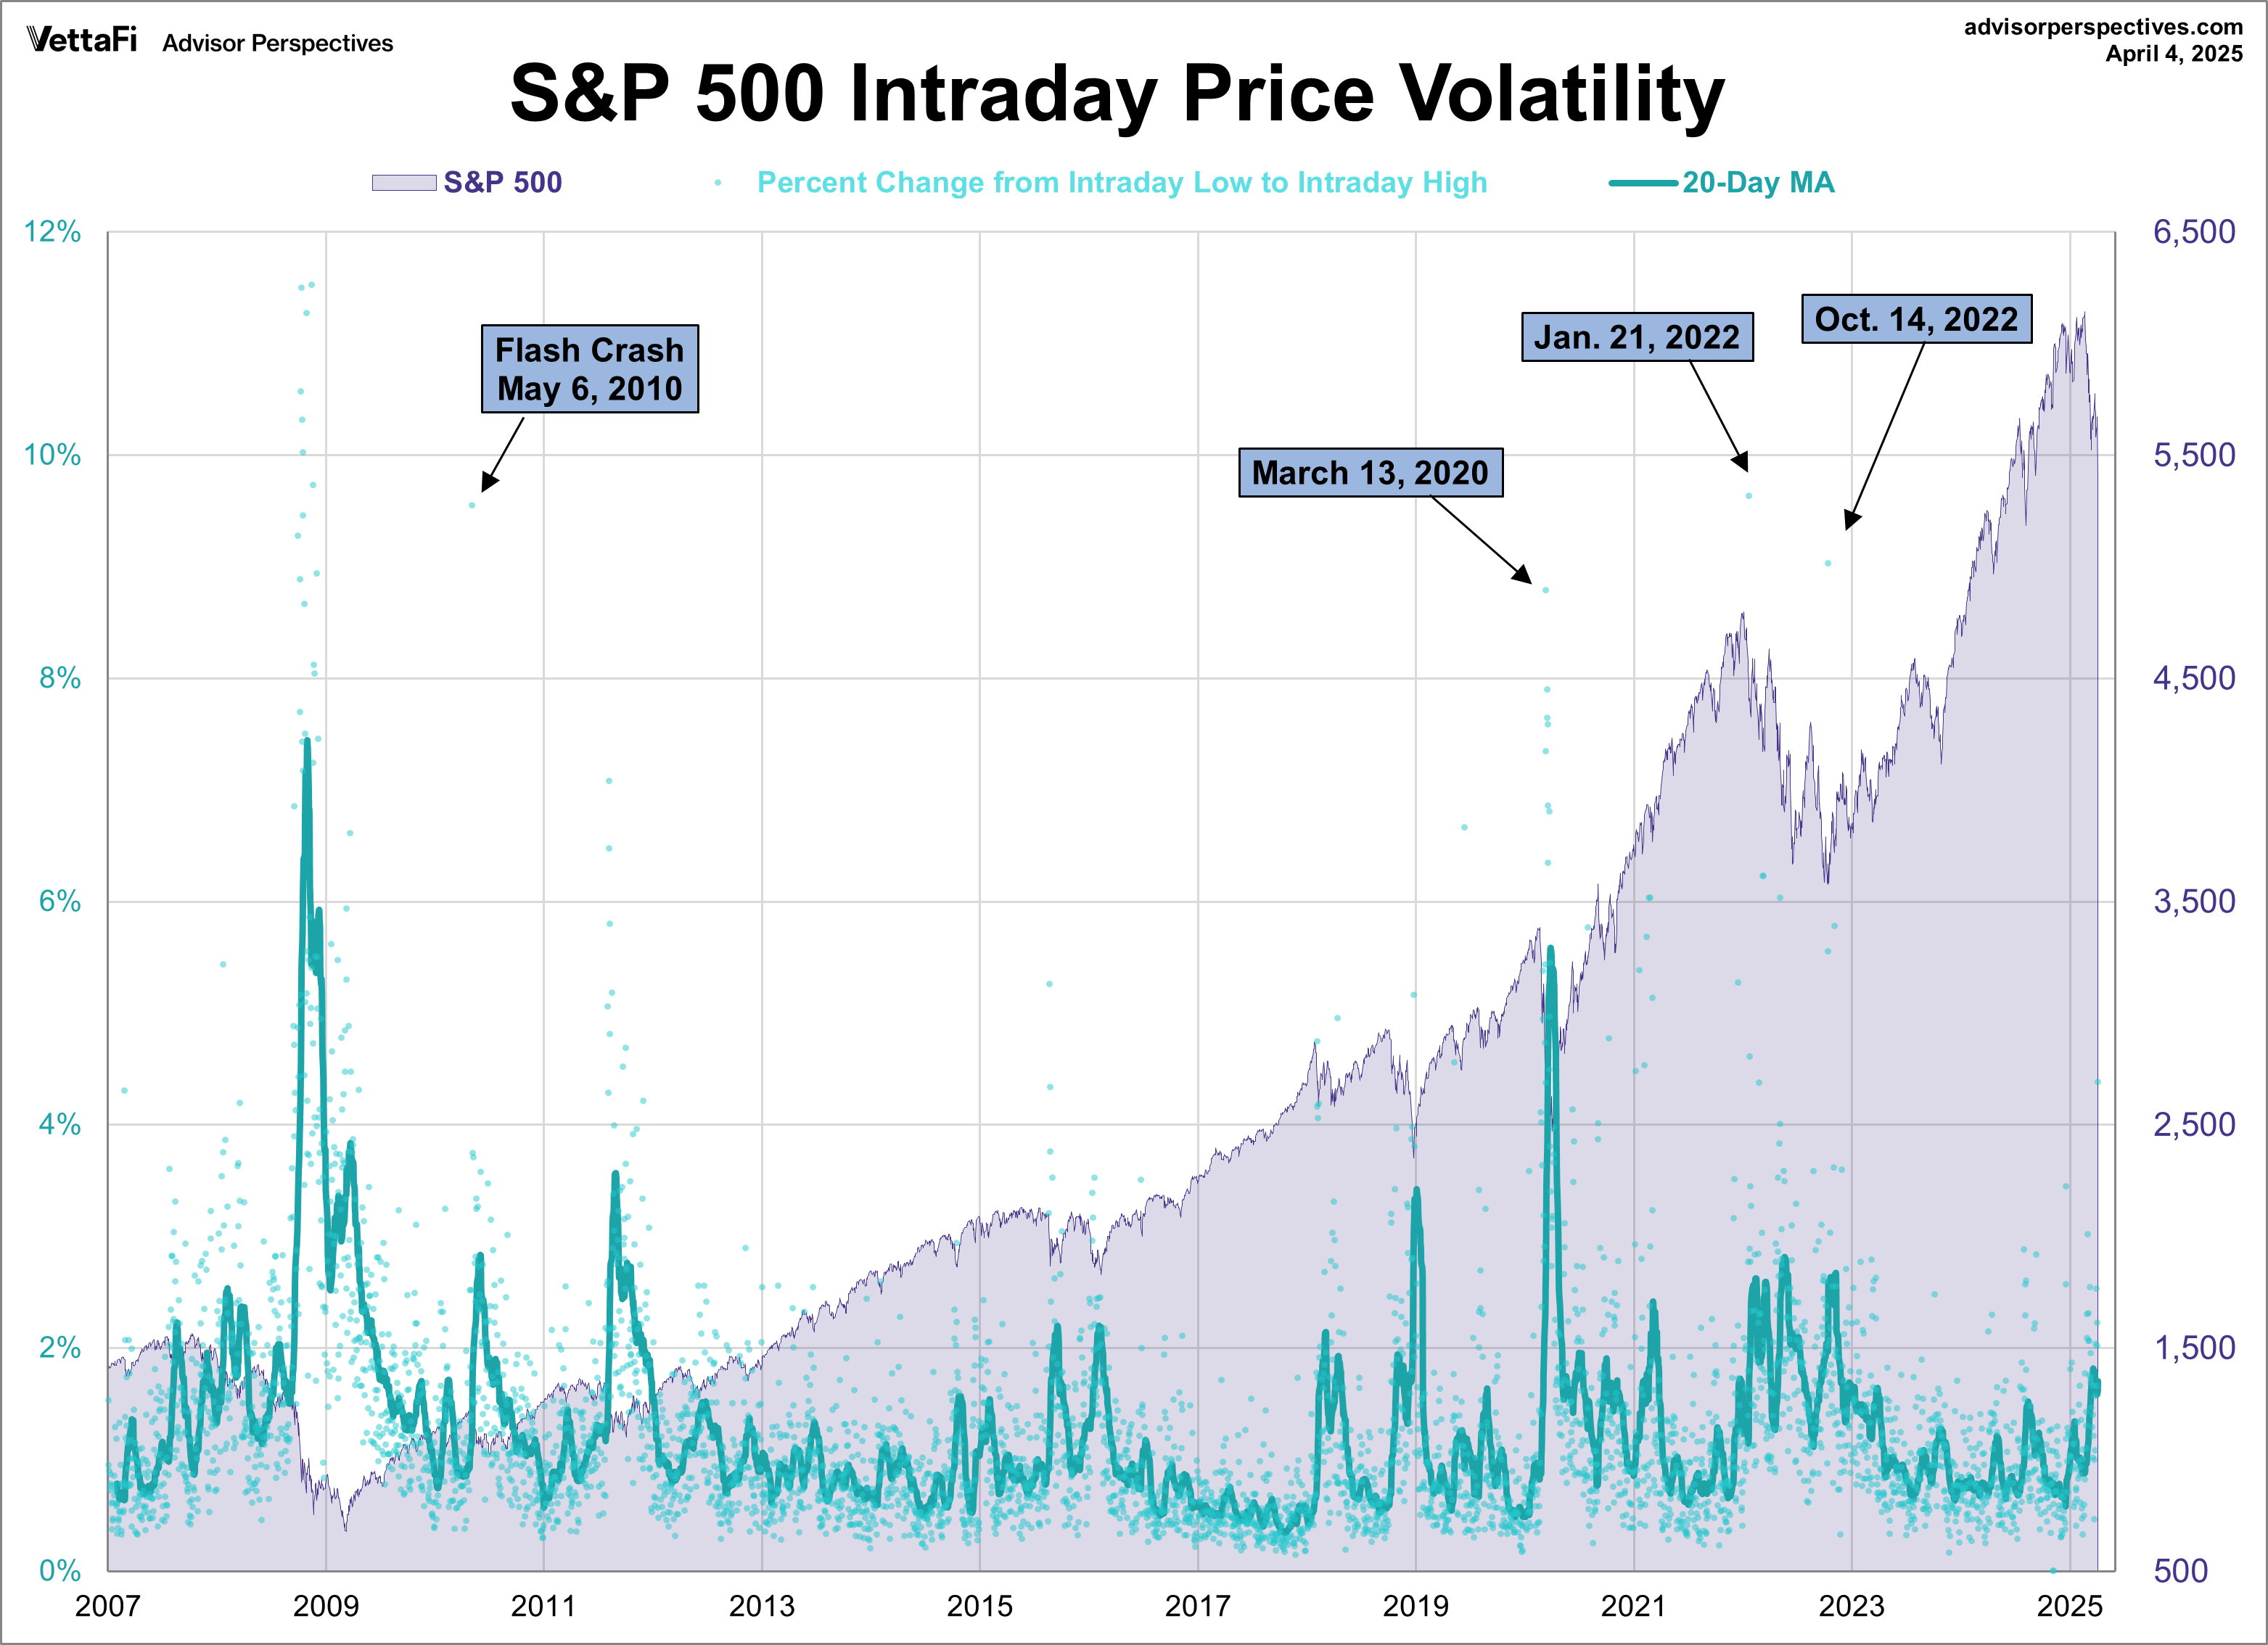
S&P 500: A Perspective on Volatility
For a sense of the correlation between the closing price and intraday volatility, the chart below overlays the S&P 500 since 2007 with the intraday price range. On April 4th, the index experienced its largest intraday price volatility (4.38%) since November 4th, 2022 (5.78%). Also included is the 20-day moving average to identify trends in volatility. Over the past 20 days, the average percent change from the intraday low to the intraday high is 1.70%.
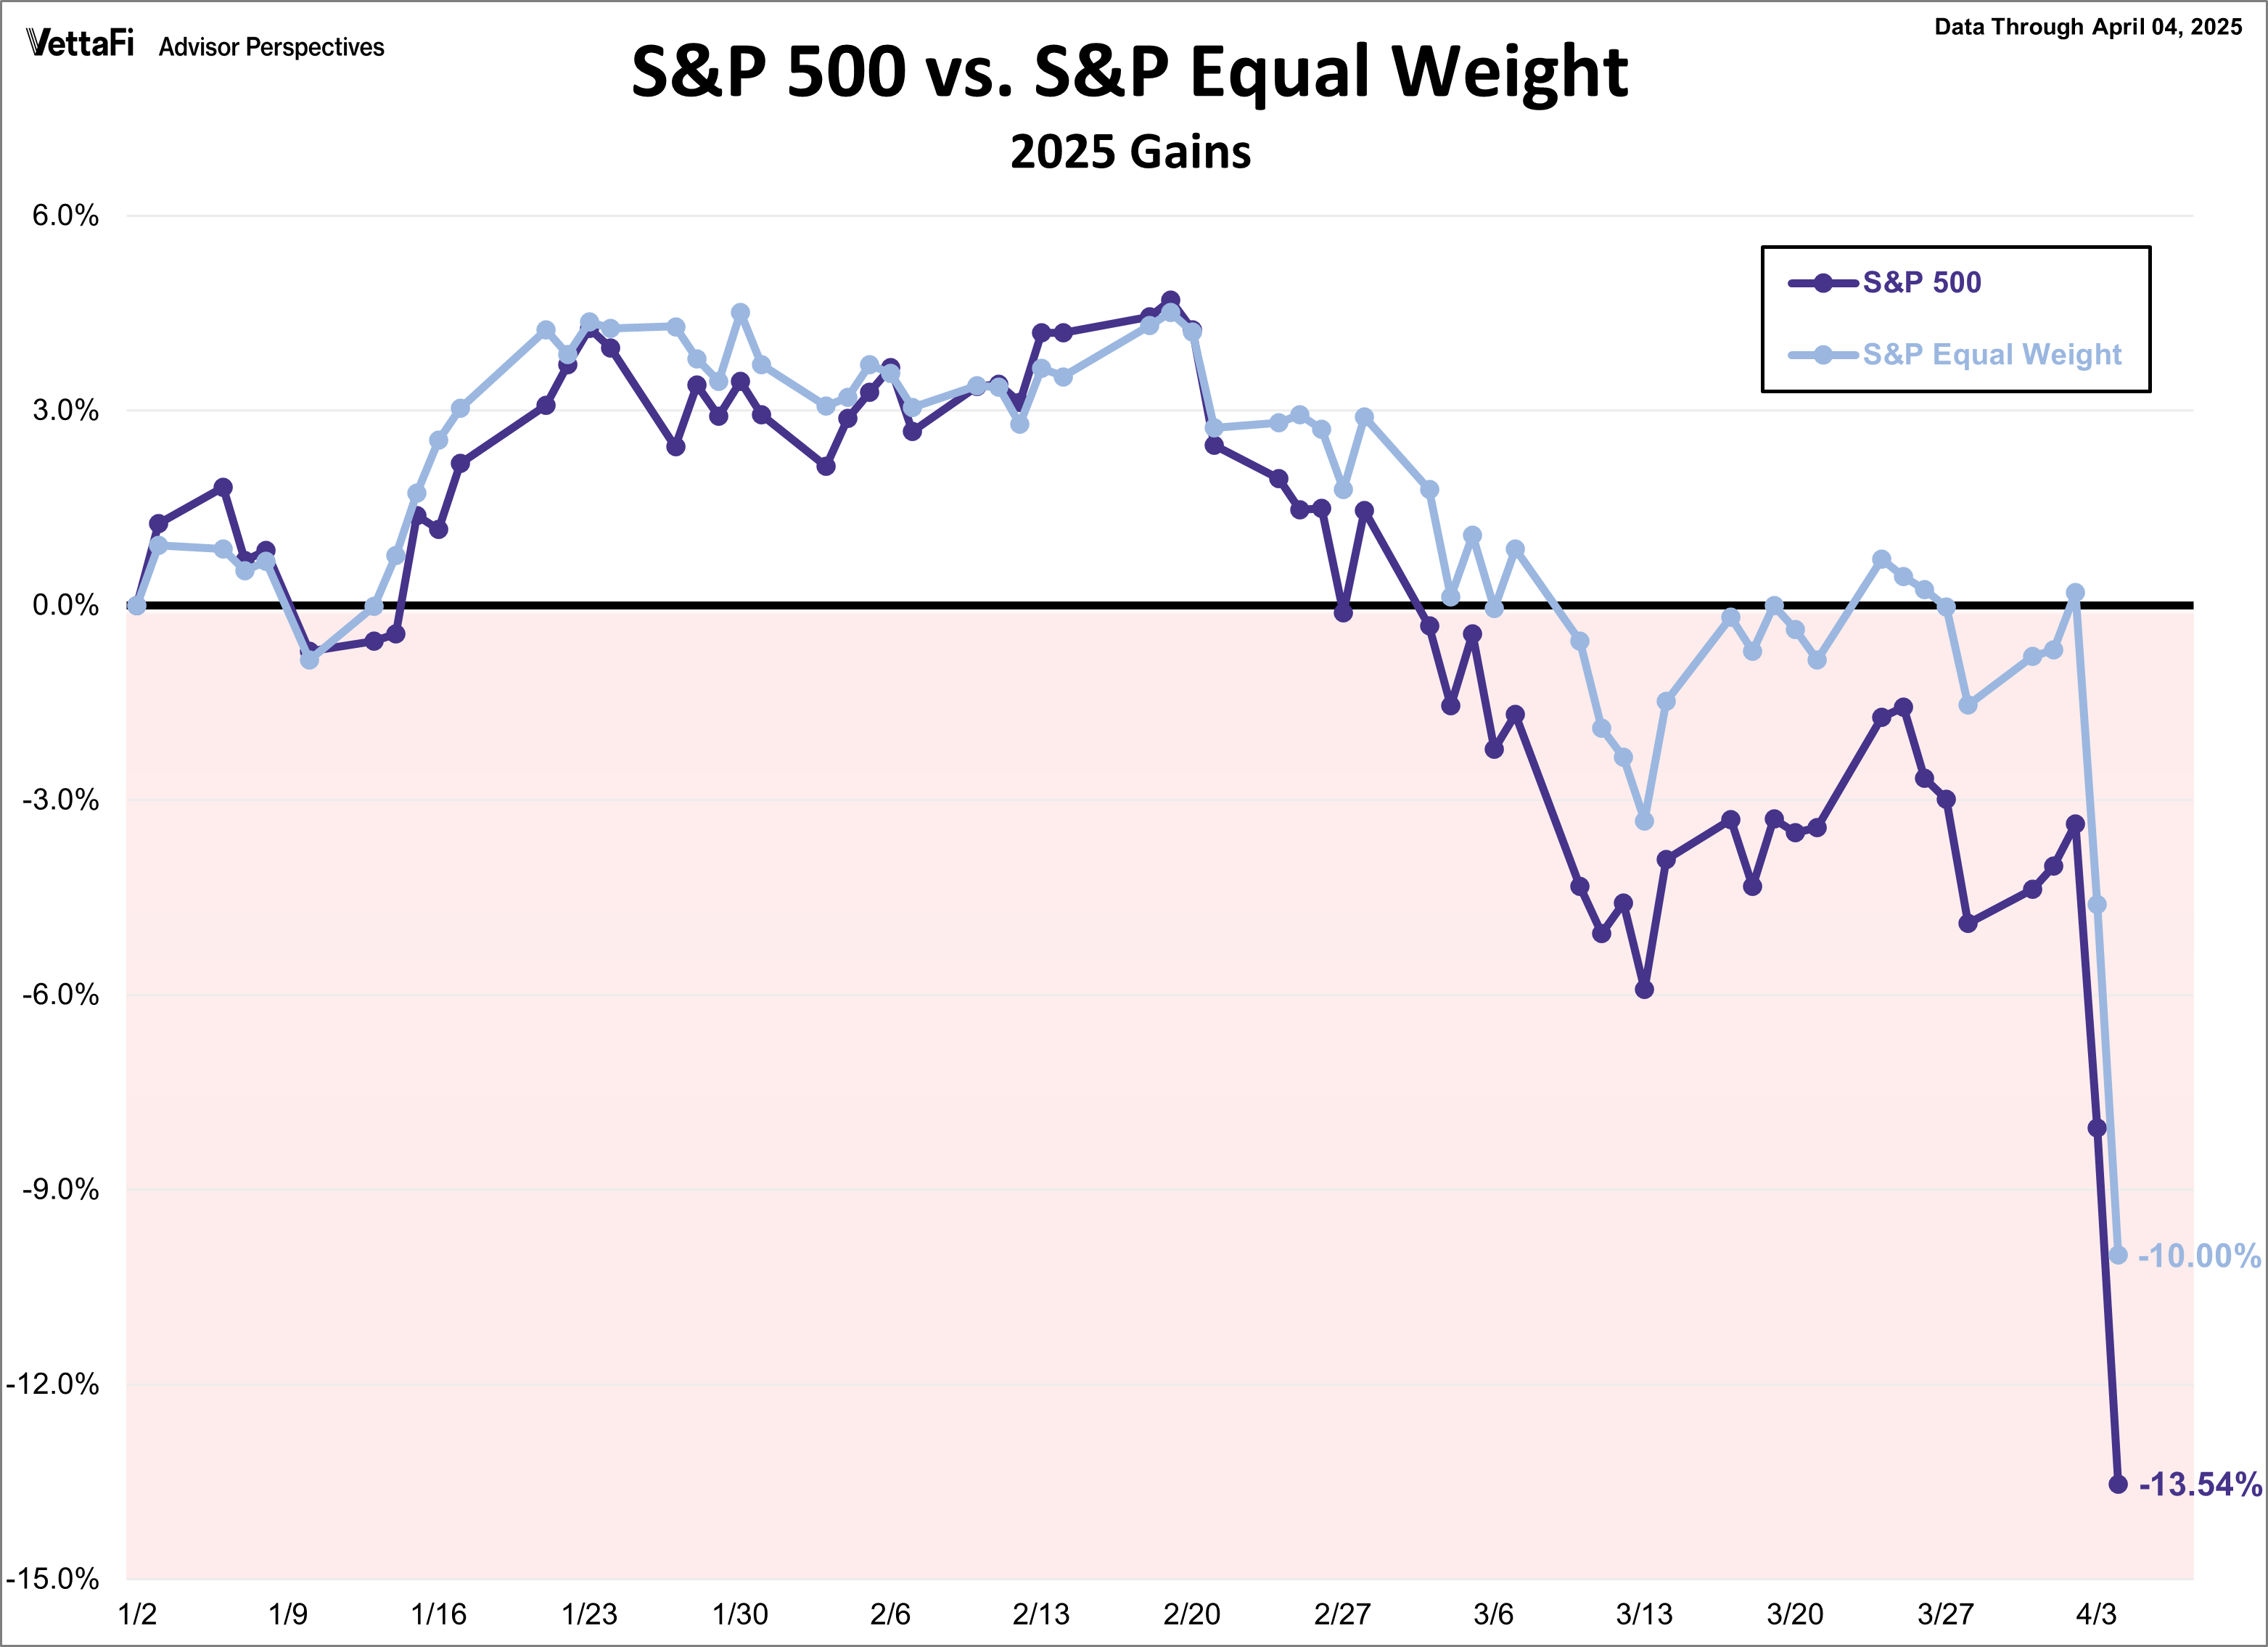
S&P 500 versus S&P Equal Weight
The S&P 500 is market cap-weighted index which includes roughly the 500 largest U.S. stocks spanning 11 sectors. The S&P 500 Equal Weight Index includes the same constituents as the S&P 500 but each company is equally weighted at a fixed weight. So how do these two indexes match up against each other this year?
The S&P 500 is currently down 13.54% year to date, while the S&P Equal Weight is down 10.00% year to date.
ETFs associated with the S&P 500 include: iShares Core S&P 500 ETF (IVV), SPDR S&P 500 ETF Trust (SPY), Vanguard S&P 500 ETF (VOO), SPDR Portfolio S&P 500 ETF (SPLG), and Invesco S&P 500® Equal Weight ETF (RSP).
Originally published on Advisor Perspectives.
For more news, information, and strategy, visit the Innovative ETFs Channel.
Financial Market Newsflash
No financial news published today. Check back later.


